Material Database — Frequently Asked Questions
Features
The material database provides broad coverage of common and more specialized materials, including isotropic and anisotropic BRDFs of metals, paper, car paints, organic samples, fabrics, etc. Each material is available in a spectral version that covers the 360(UV) - 1000nm (NIR) range with ~4nm sample spacing, as well as a RGB version for compatibility with renderers that do not support color spectra. The representation is extremely compact, requiring approximately 16KiB and 544KiB per channel for isotropic and anisotropic materials, respectively. Furthermore, it provides a natural importance sampling operation that does not require numerical fits or complex additional data structures. Technical details on the underlying parameterization and measurement methodology are available in the paper
An Adaptive Parameterization for Efficient Material Acquisition and Rendering
by Jonathan Dupuy and Wenzel Jakob
In ACM Transactions on Graphics (Proceedings of SIGGRAPH Asia 2018)
The measurement device and its capabilities are described here.
Future plans
We plan to considerably extend the database in the future so that it eventually contains hundreds of materials that densely cover the space of real-world material appearance. Outside help is welcome: if you have interesting samples, we'd love to measure them. See below for details.
Standalone viewer
BRDF files can be interactively viewed and analyzed using the Tekari viewer created by Benoît Ruiz. Tekari plots the BRDF and sample locations with respect to different incident angles and/or wavelengths, using a variety of powerful visualization tools. Click the following link to download precompiled 64-bit executables for OSX, Windows, and Linux. To open a material, simply drag & drop the “_spec.bsdf” file onto the application, or provide the filename as a command line argument. Note while Tekari is an open source project, it depends on a component, whose source code is not yet available (hence the precompiled binaries).
C++ and Python API
We've released a reference BRDF implementation, which provides the standard operations needed by most modern rendering systems: BRDF evaluation, sampling, and a routine to query the underlying probability density. The repository also contains a plugin for the Mitsuba renderer and Python code to load the data files into NumPy, which is useful for visualization and systematic analysis of the database contents.
Raw data
A gonio-photometer typically cannot measure all angle combinations due to optical and mechanical limitations (for instance, the sensor occludes the light source at certain angles). Our measurement pipeline detects such cases and extrapolates the missing data from other measurements. To provide transparency on what parts of the data correspond to actual measurements, we provide “raw” data files containing an extremely verbose log of the entire acquisition process in Python pickle format.
Understanding the visualizations
Clicking on the material reveals a number of visualizations:
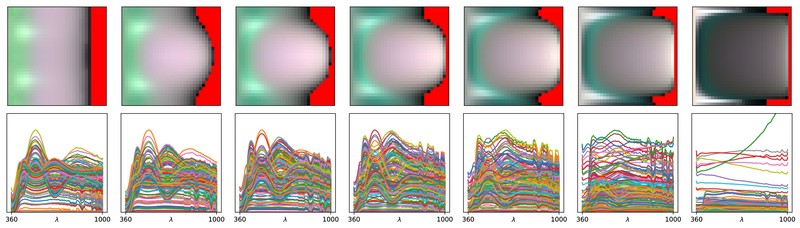
Slice (measured): The first image shows an RGB rendition of what was measured by the spectrometer. Note that the data typicaly has extremely high-dynamic range, hence some detail in the black may simply be invisible. Red pixels correspond to wasted space of the discretization. The black column on the left is a region that could not be measured.

Slice (processed): This plot contains the same data, but after post-processing. The black regions on the left were filled in, and the data was scaled by the Jacobian of the parameterization (see the paper for details). This has the effect of making the representation significantly easier to interpolate. The bottom row shows spectral curves in the 360..1000nm range corresponding to the row above.
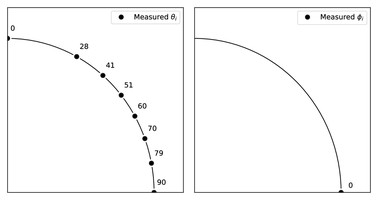
Parameterization: shows incident and outgoing angles, for which the material was measured.

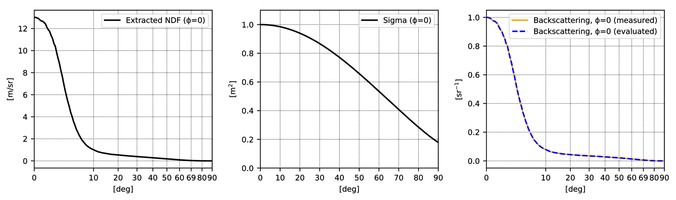
NDF: Our method heavily relies on the material's retroreflective reponse. This plot shows the extracted normal distribution and the resulting backscattering (theory & actual).
Measured angles: 2D visualization of the measured elevations (left) and azimuths (right)
Discretization/noise artifacts in viewer?
A number of materials may show grid/noise-like artifacts when visualized in the Tekari viewer. This is not a problem of the data, but rather an artifact of the visualization method involving Delaunay triangulation. You can simply increase the resolution in the “Sampling Resolution” panel.
Licensing conditions
Unless otherwise noted, all material data is licensed under the Creative Commons Zero (CC0) license.
Measurement service
We plan to considerably extend the database in the future and would be happy to measure samples provided by you for free. Please reach out to us if this sounds interesting. There are a few strings attached:
- We are mainly interested in materials that are sufficiently interesting/different from ones that are already in the database, so do reach out before mailing us something.
- It must be okay for us to include the resulting measurement in the database under a CC0 license.
- Samples must be flat and sufficiently large (>= 10x10cm, ideally >= 20x20cm) so that they can be accommodated by our sample holder. If you have odd-sized, non-rectangular, and/or non-flat samples, please send them to us mounted on a suitable rectangular substrate.
- We constantly improve our measurement pipeline and will occasionally re-measure large sets of samples when the process has changed beyond a certain point. To be able to do this, we need to physically keep the samples at our lab in Lausanne, Switzerland. We are only able to return-samples if there are extremely good reasons to do so (very expensive samples like precious metals, unique specimens, etc.). In this case, we would ask you to cover any return mailing costs including insurance.
Changelog
We routinely add additional materials to the database. More significant changes will be listed here.
- Nov 1, 2018. A larger sturdier sensor arm (which can be used to mount high-res camas) was installed on the gonio-photometer. One potential downside of the change is that the head is larger and thus increases the set of shadowed configuration where the head partially or fully blocks the collimated beam. It is worth noting that the computation used to detect such shadowed configurations is somewhat conservative. To enable future improvements in case an improved shadowing detection logic is developed later, RAW files produced by the latest measurement pipeline (v3.3+) also record measurements even for supposedly shadowed configurations.
- Nov 14, 2018. Remeasured & processed all silk_* and vch_* materials with the latest measurement pipeline. The previous dataset contained visible interpolation artifacts produced by an older pipeline.
- Nov 20, 2018: We've added a number of paper samples of different colors. Paper, especially the white variant, contains brightening additives, that absorb in the UV and emit in the blue range. Our current measurements setup does not account for such fluorescent effects, which would require separate measurement of the incident and outgoing wavelengths. As a result, the material is seen to emit more light than it receives, which breaks energy conservation and produces convergence artifacts in renderings. We still include such materials in the database, but they are likely not directly usable.